Overview
Classifying Urban Typologies
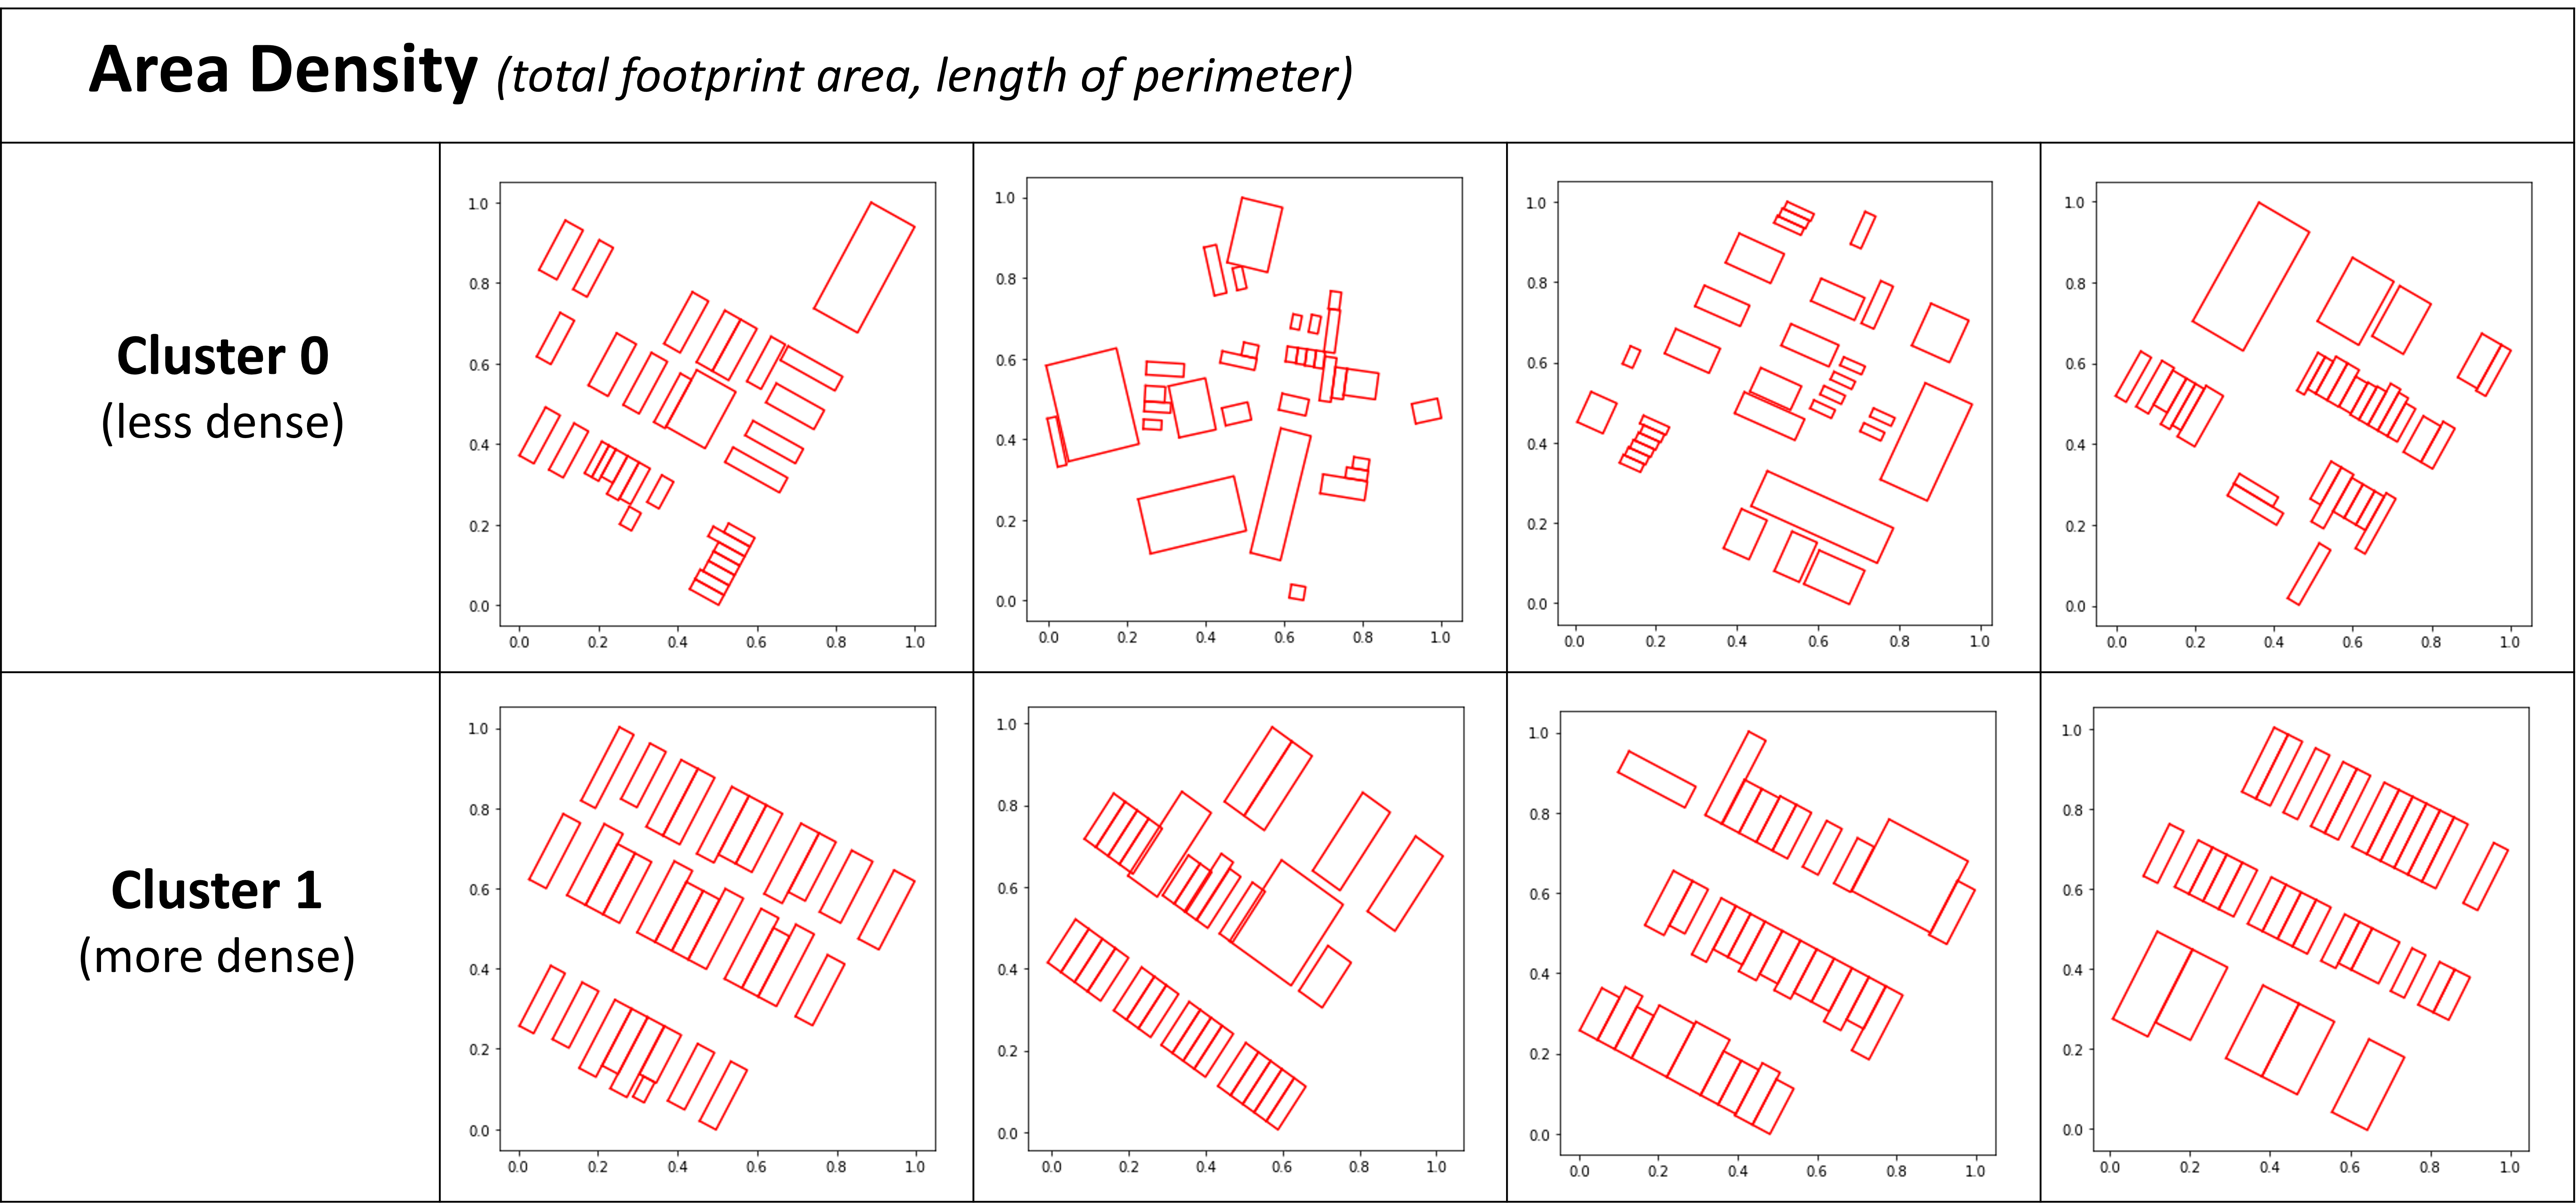
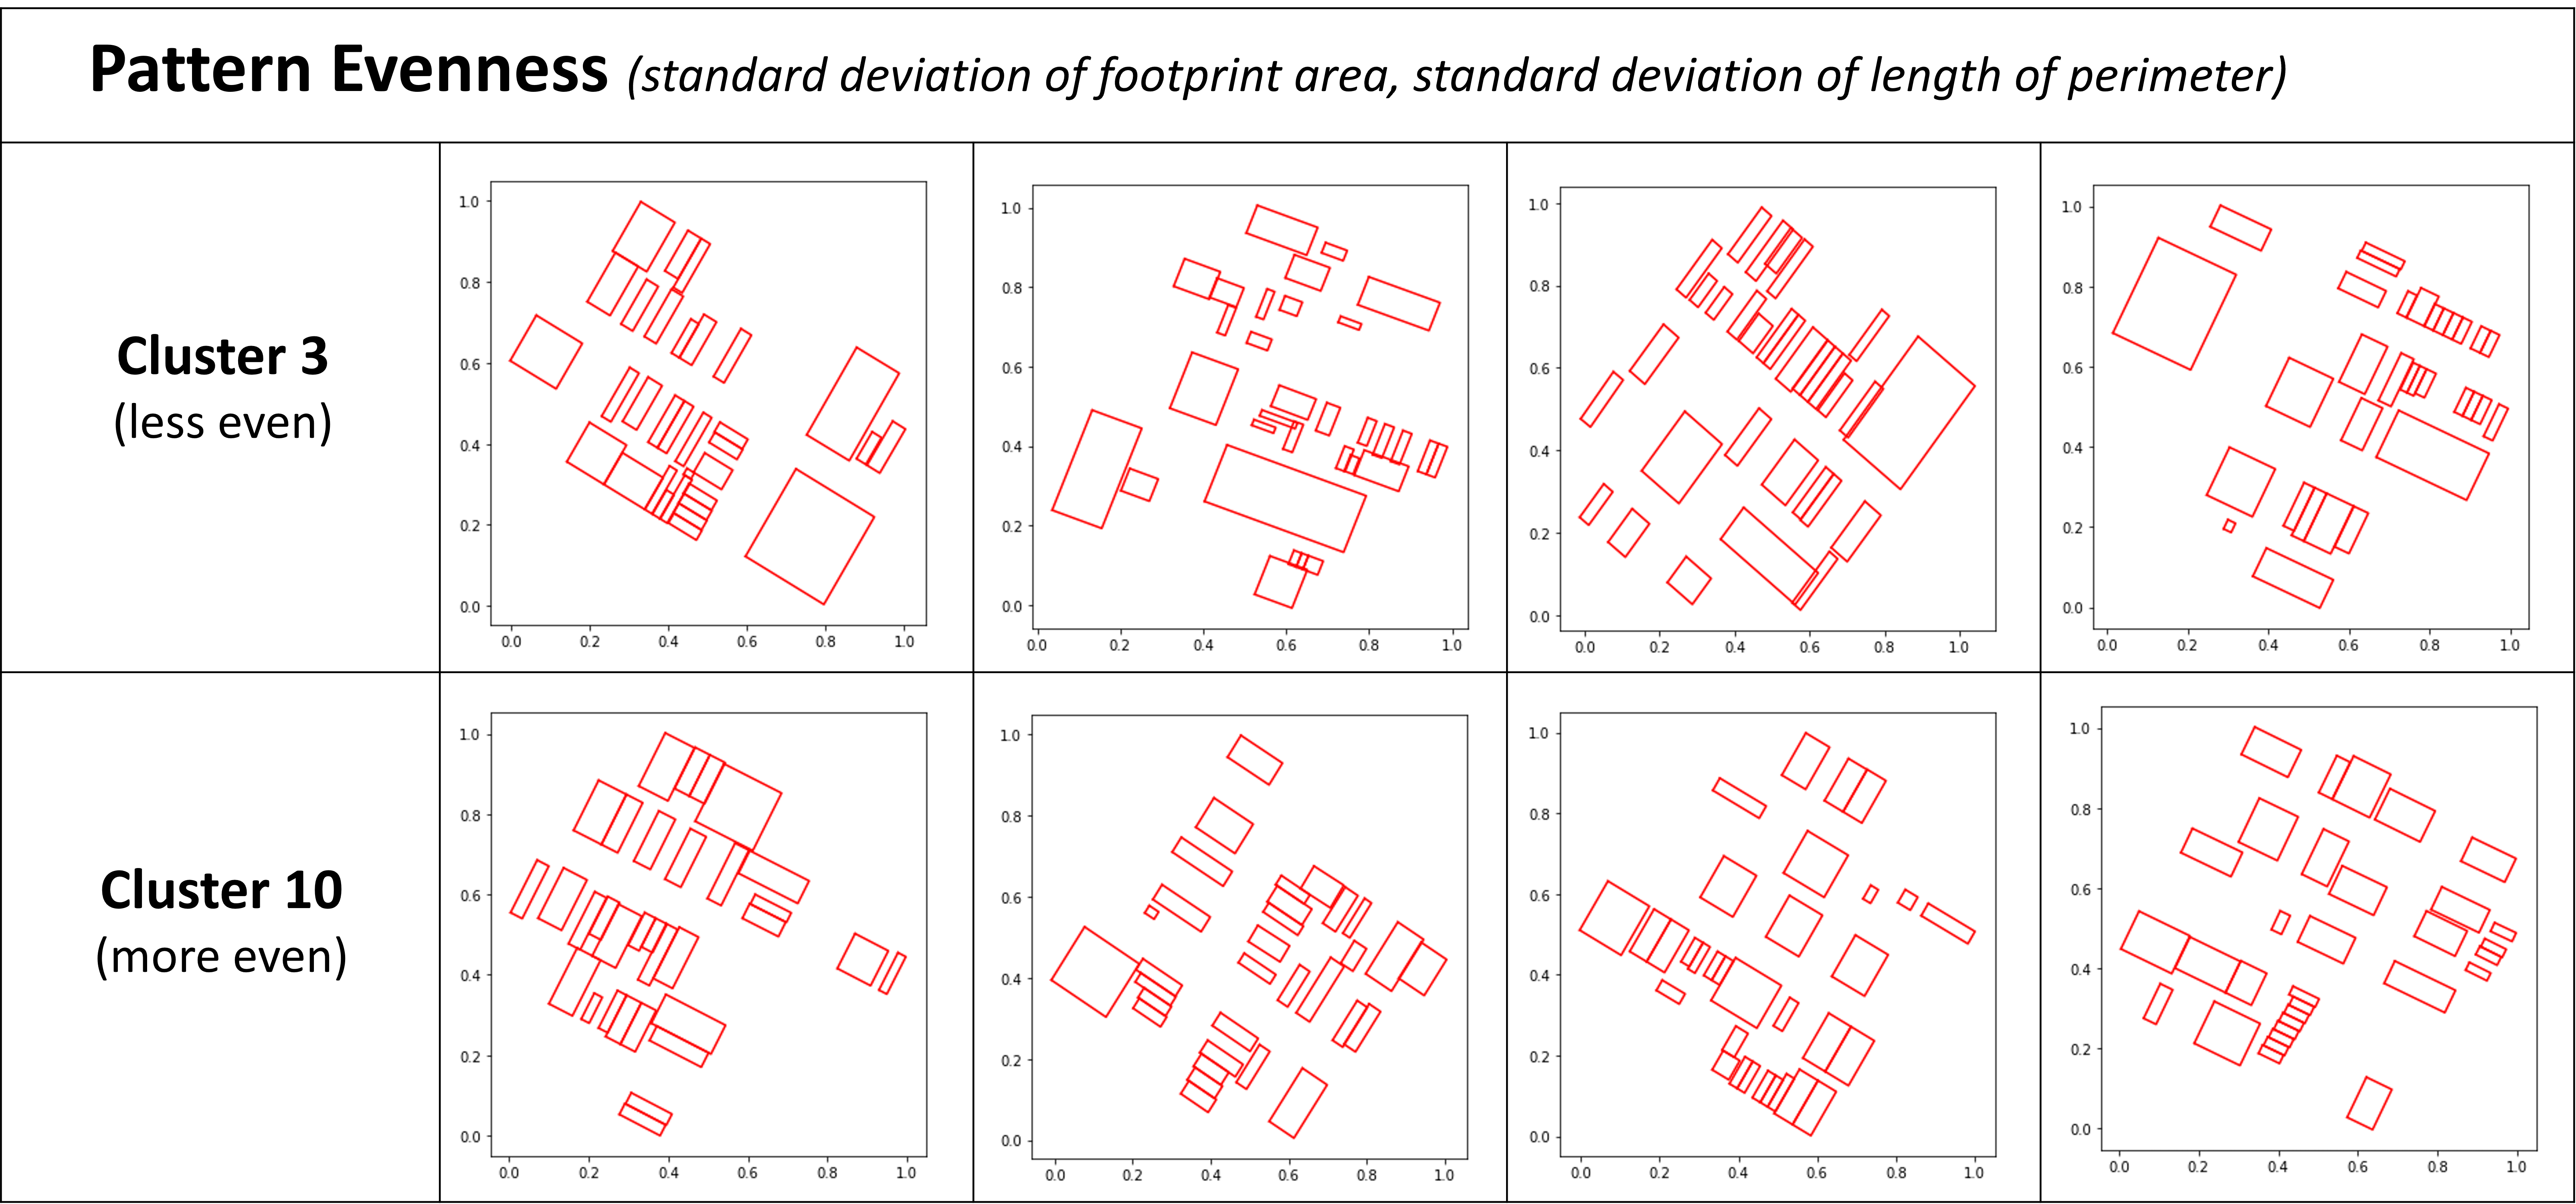
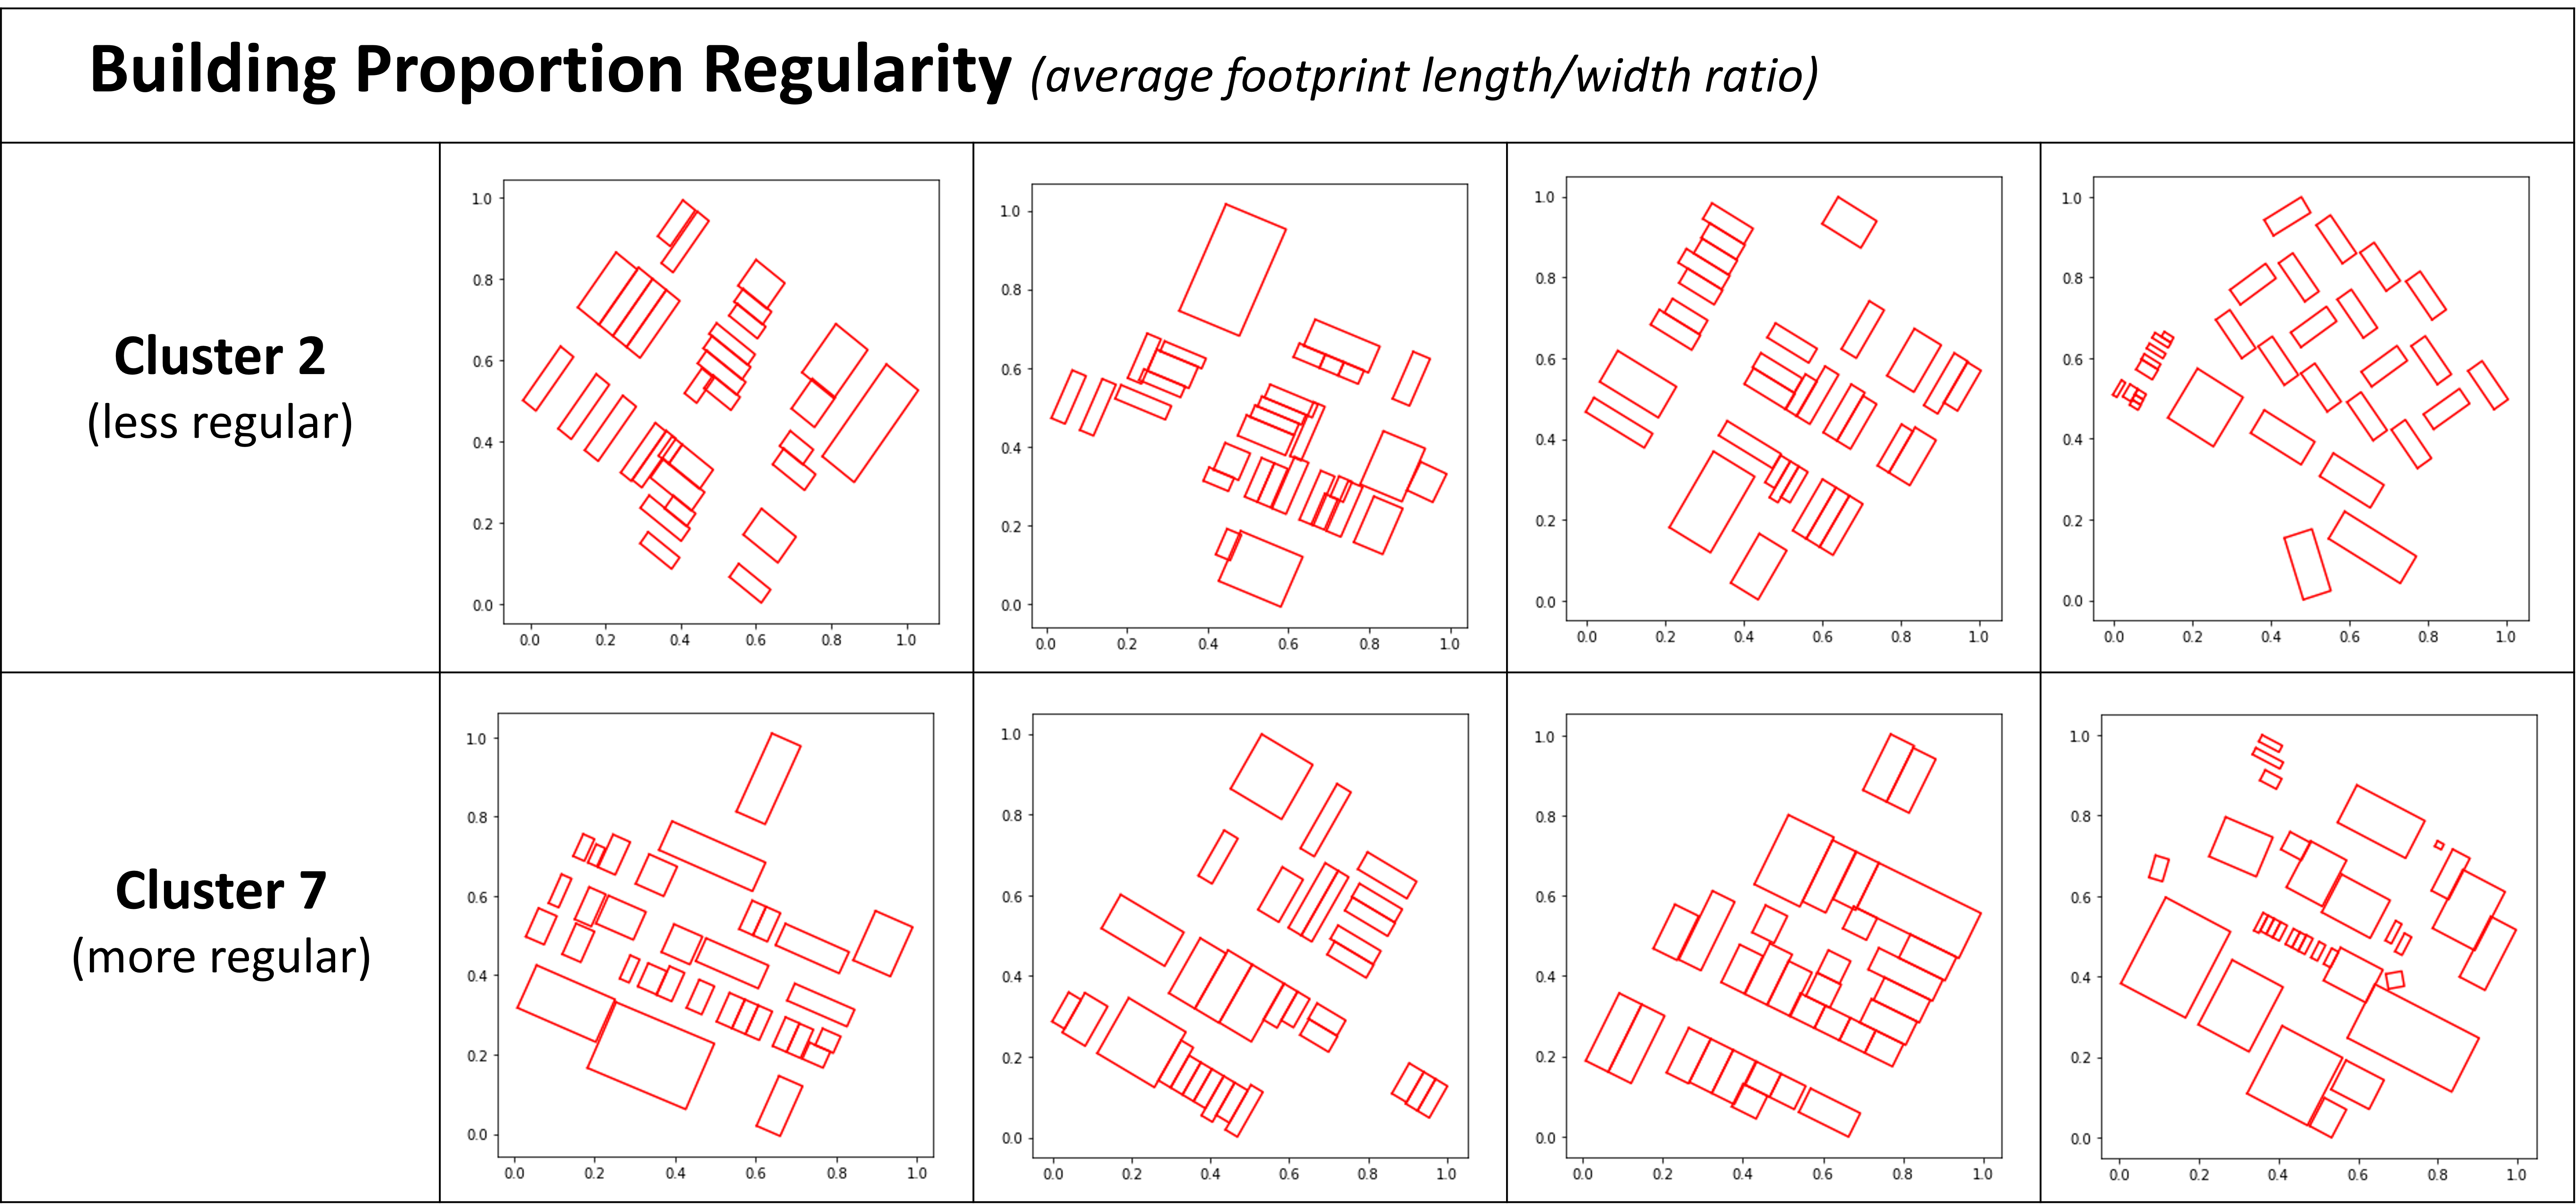
- Clustering of Latent Space using Gaussian Mixture Model (GMM). 512 latent features are compressed to 50 principal components, explaining 68.8% of the dataset variance. GMM was used to cluster the principal components.
- Measuring Feature Contributions using Shapley Values. Shapley Additive exPlanations (SHAP), was used to determine the contribution of each geometric feature and explain the output of the machine learning models.
- Geometry Statistics by Latent Space Clusters. Summary statistics of the top contributing geometric features were used to identify and profile distinct clusters.
Measuring Neighborhood Layouts
- Calculating Manhattan’s Urban Profile. By calculating the percentage composition of the 11 urban layout typologies, we are able to define an overall baseline for Manhattan’s urban profile.
- Measuring Neighborhood Urban Profile. Similarly, we can calculate the urban profile for each Manhattan Neighborhood Tabulation Area (NTA) to understand their unique patterns.
- Constructing Standard Metric for Urban Layout Composition. We derive a standard metric for measuring the neighborhood urban layout composition by reducing the multi-dimensional neighborhood profile.
- Using this standard metric, urban planners can evaluate how new urban layouts design change the neighborhood profile, relative to city baselines.
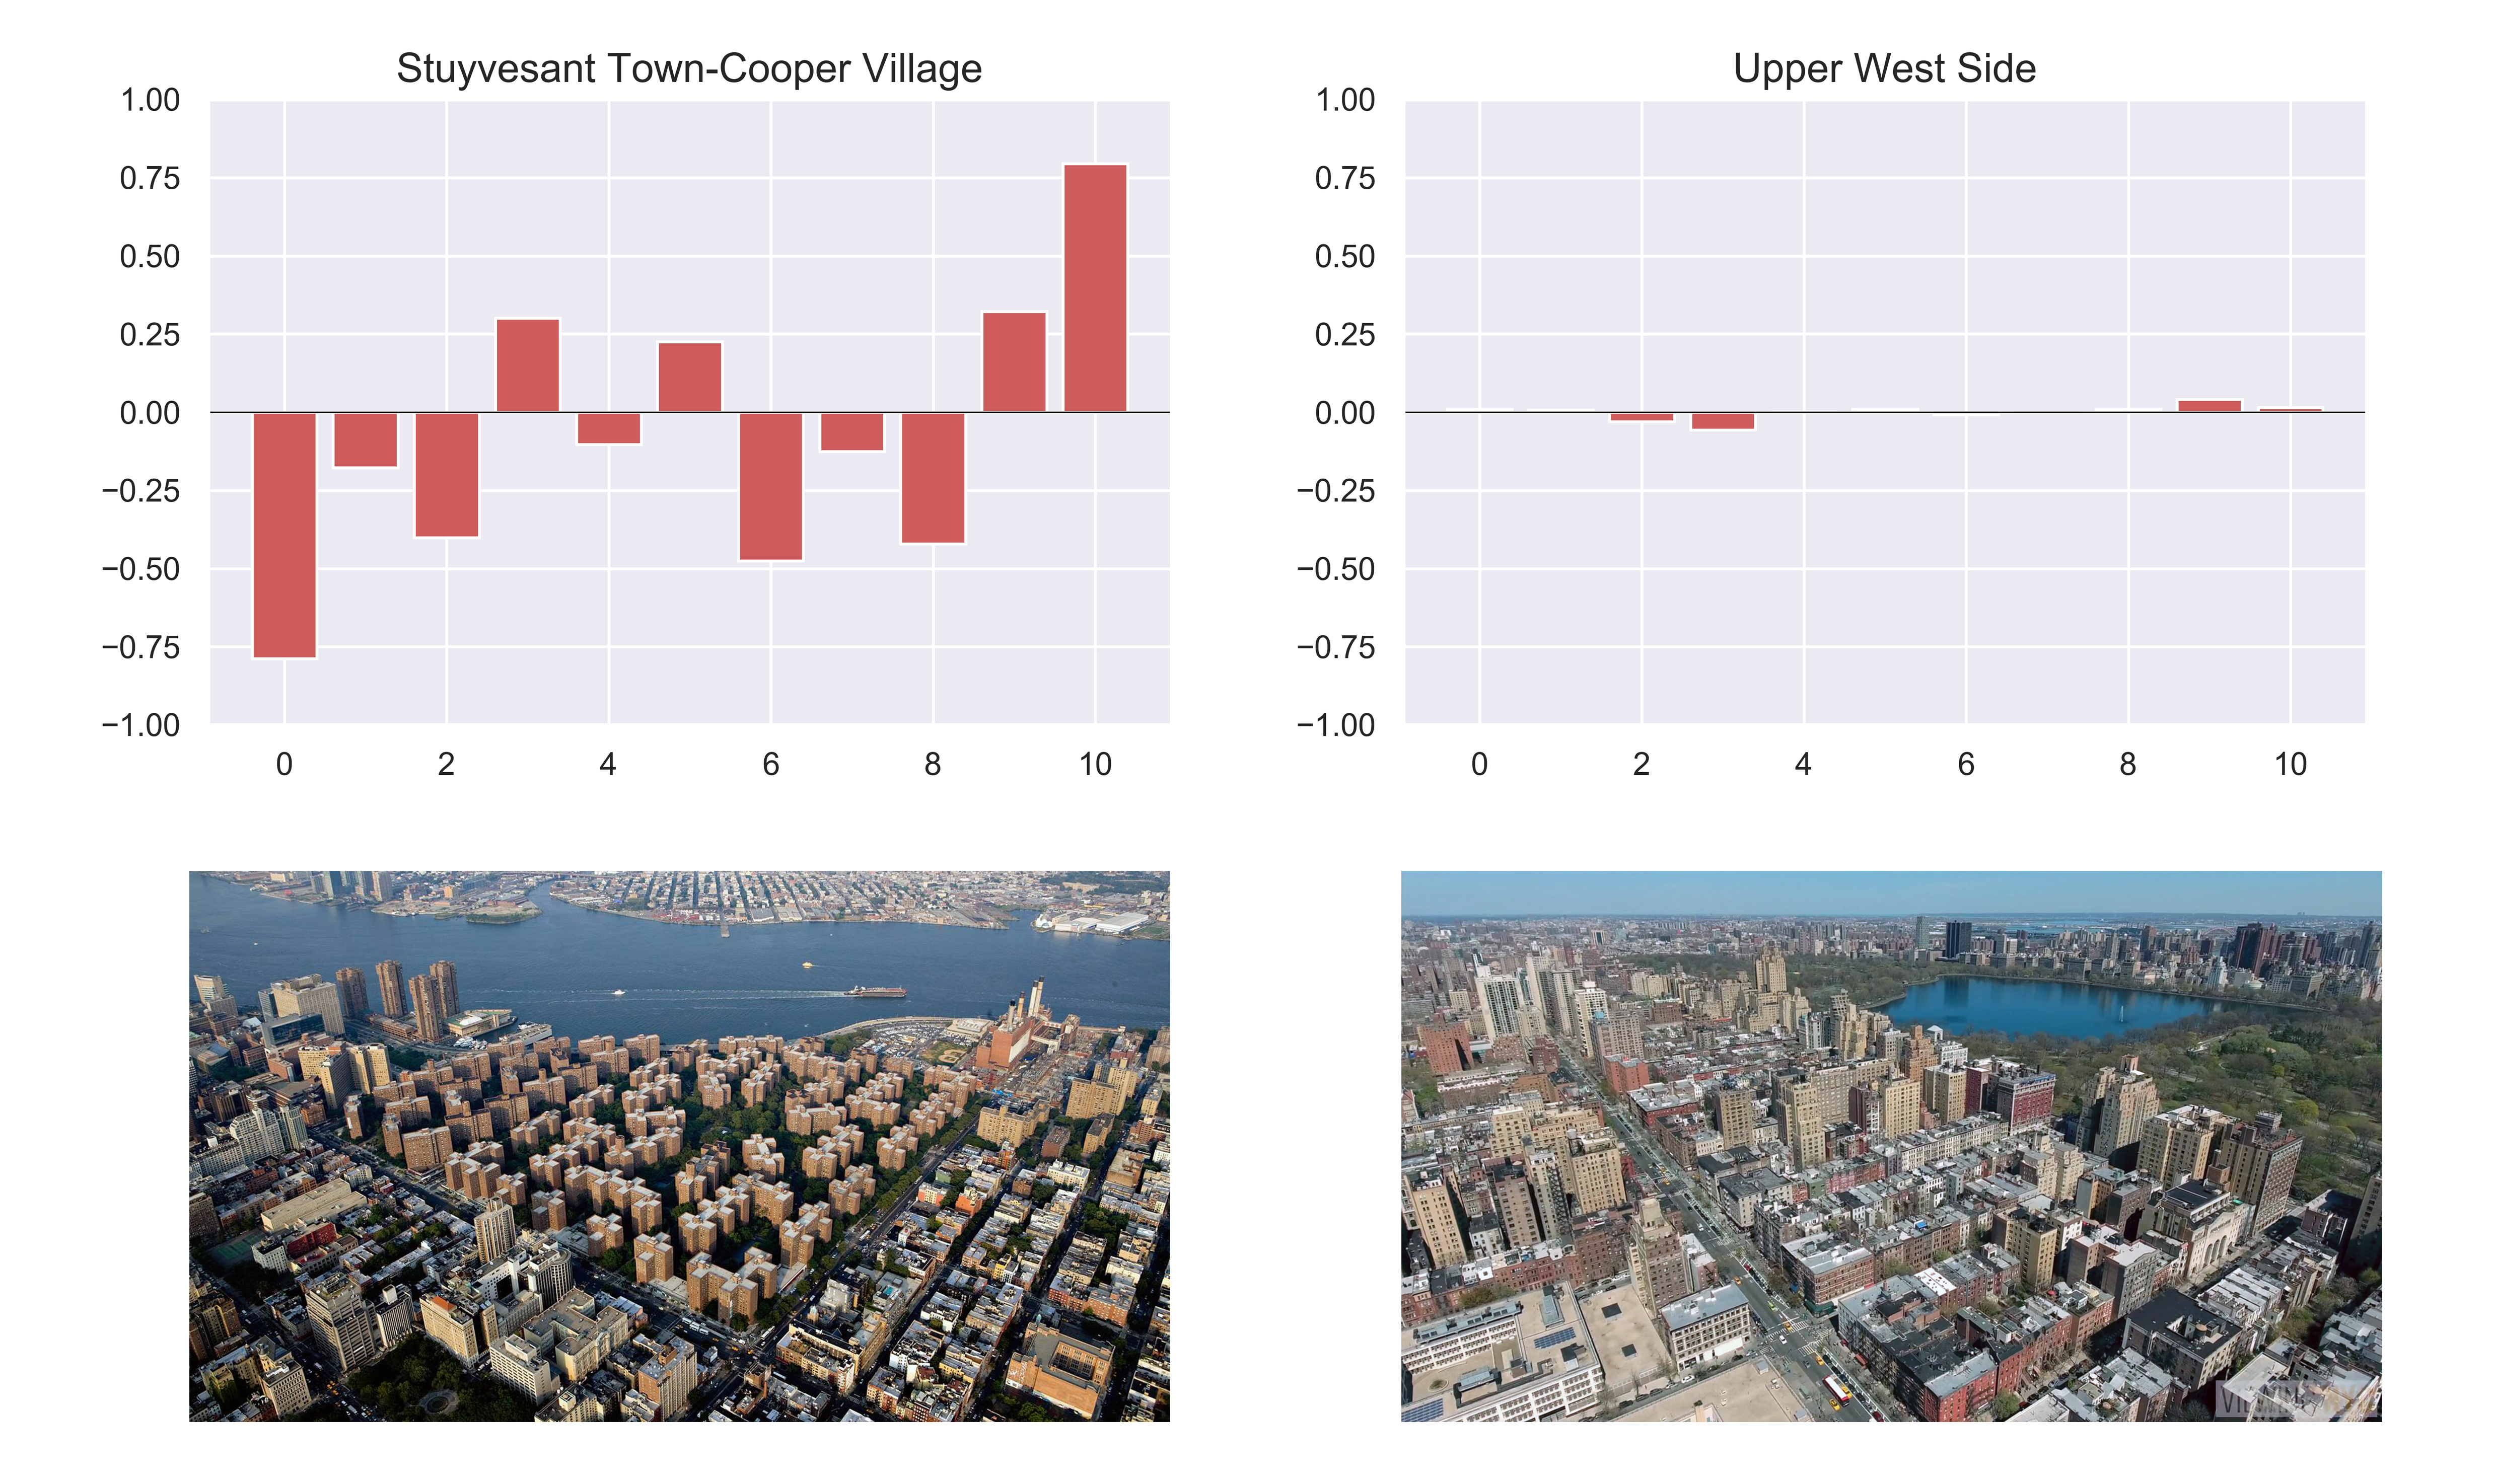
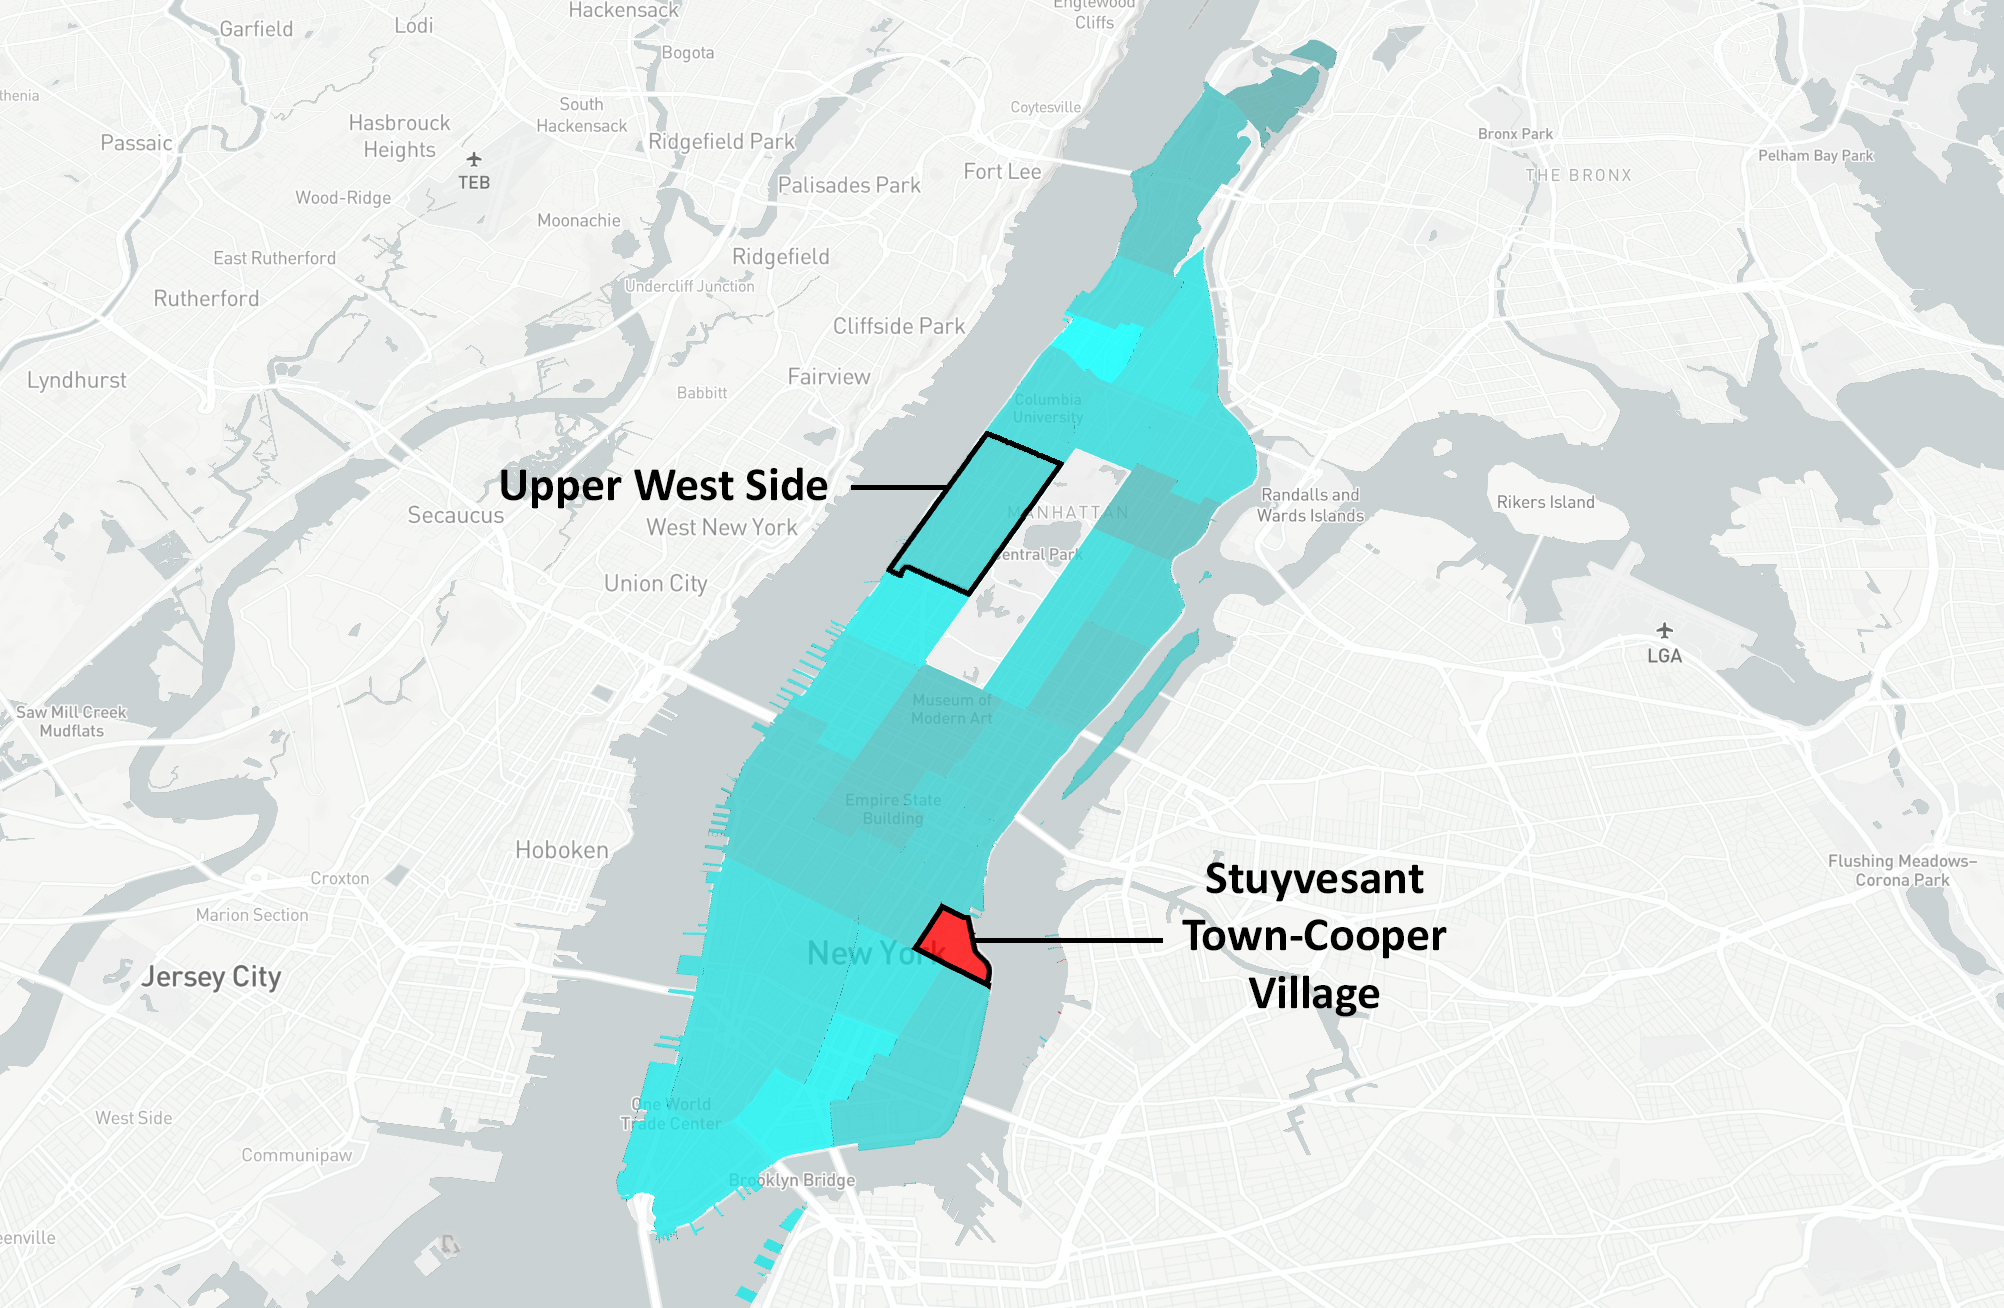
Our neighborhood profile analysis shows that Stuyvesant Town-Cooper Village (left) deviates greatest from the Manhattan urban profile, while the Upper West Side (right) is most similar.
Generating Composite Layouts
- Blending urban layouts. By decoding the linearly interpolated values of two latent subspaces, we are able to generate realistic urban layouts that resemble two dissimilar layouts.
- Urban planners can use this tool to rapidly generate new layouts that are contextually sensitive to the surrounding urban typology.